
Form view reports and analytics
The form view report shows how many people have seen your form, so you can compare it with responses and improve the form.
When you publish a form and post its public link on your website, on social media, or in a message to a customer, you naturally want to know whether anyone actually sees it and how many visitors end up completing it. Taskie keeps a view report for every form and shows the number of submitted responses next to it. Instead of guessing, you make decisions from two real numbers: how many people saw the form and how many filled it in.
This page shows where to find the view report, what each number means exactly, how today's live stats differ from previous days, and, most importantly, how to read views alongside responses to find your form's weak spots and improve it.
Where to find the view report
Every form has several tabs at the top of its page: Builder, Create task, Settings, Appearance, Responses, and View stats. The view report lives in the View stats tab. Next to these tabs, you'll also see the Total responses counter and the form's status badge (Published or Draft), so you have the form's overall state in one place.
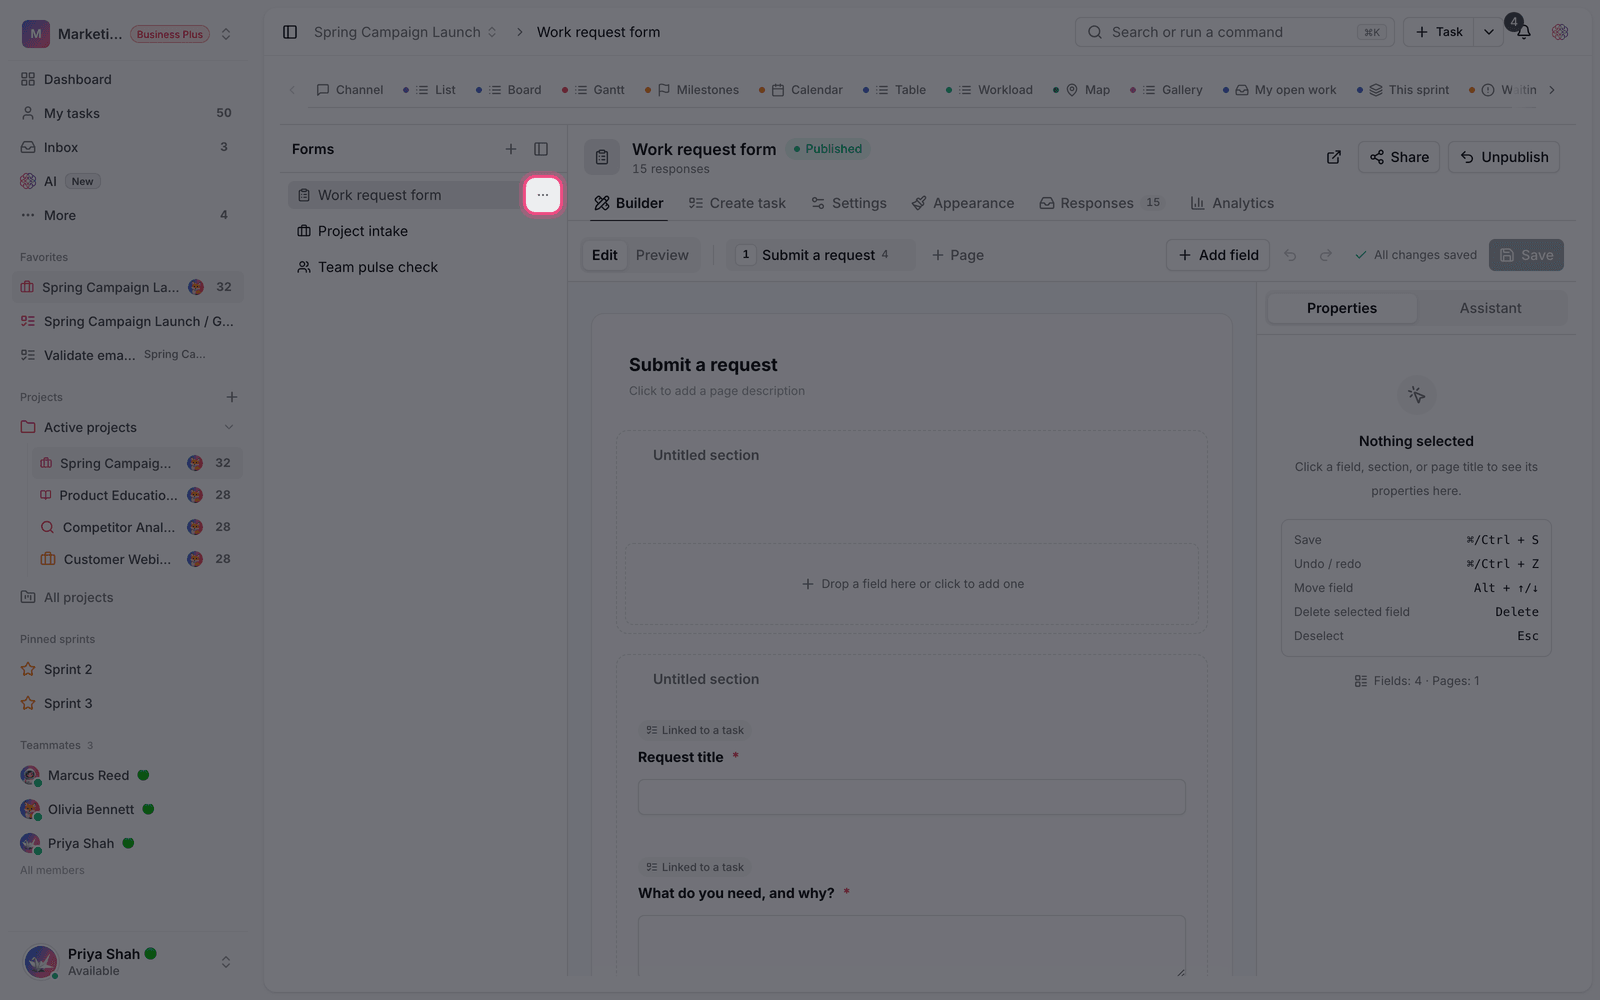
- Open the project and go to Forms from the views bar.
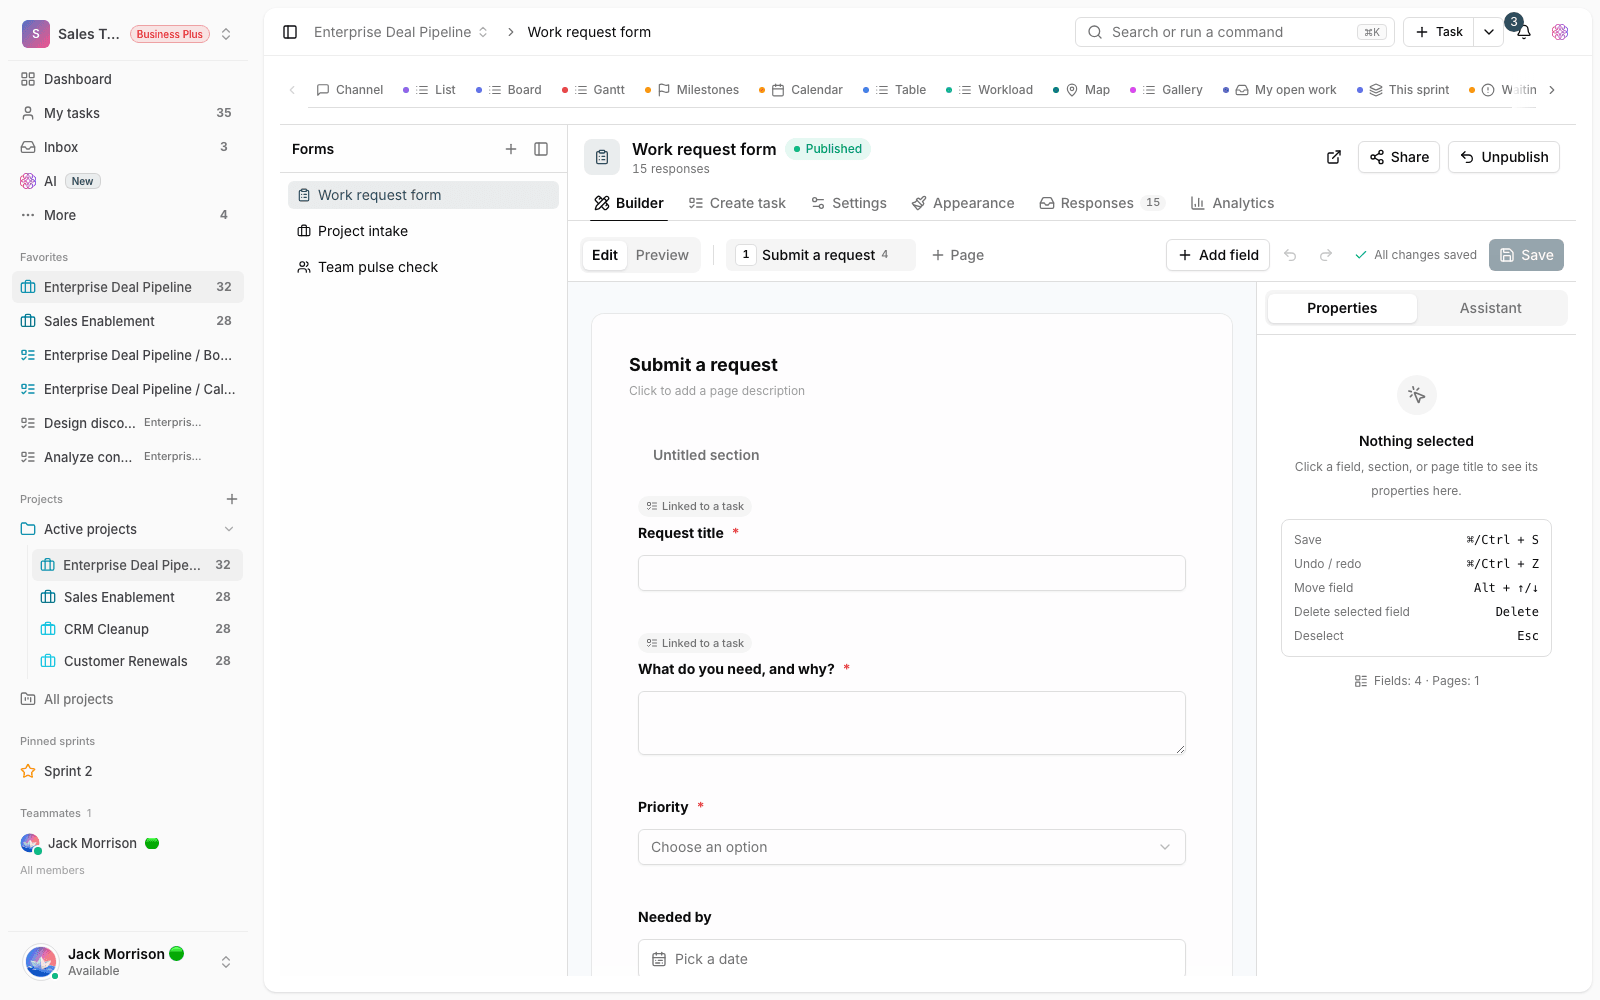
- Select the form you want from the side list.
- In the tabs at the top of the form, click View stats.
- Look at the Today's views section at the top and Previous days further down.
- To see the number and content of responses, go to the Responses tab.
What the view numbers tell you
Three summary cards appear at the top of the report. The key point is that views are counted as unique: if one person opens or refreshes the form page several times within a period, only one view is recorded, so the number isn't inflated by repeat visits from the same person.
- Today: the form's unique views from the start of today up to this moment, live.
- Previous days: the total views for all days before today.
- Total views: the grand total, meaning previous days plus today.
Views are counted only on the public page of a published form. Opening the form in preview mode or inside the builder doesn't count as a view. That's why a form in Draft has no public page and records no views; counting starts the moment you publish. All hours and days are calculated in one fixed reporting time zone, so everyone on the team sees the same figures.
Today versus previous days
The report has two sections with two kinds of data: Today's views is live and real-time, while Previous days is totaled and saved once every 24 hours.
- Today's views: a 24-hour bar chart showing the unique views for each hour, with an hour label every three hours. It's useful for spotting your busiest hours.
- Previous days: a bar list of daily views for roughly the last 30 days, labelled by date. This section shows the daily total after nightly processing.
Because of this, on a newly published form the previous days section may be empty and show the message No daily data recorded yet. That isn't an error. Today's stats appear right away, but yesterday's views are added to the previous days list only after the first nightly processing run.
Read the results to improve your form
The report's real value shows when you put views next to responses. Views tell you how many people saw the form, and the number of responses in the Responses tab tells you how many completed it. The gap between those two numbers is the clearest signal for improving your form.
- Compare views with total responses. Many views with few responses means people see the form but abandon it halfway.
- If responses are low, shorten the form, remove unnecessary required fields, and, if CAPTCHA is on, review how strict it is.
- Look at the hourly chart to find your busiest hours, and share the link or a reminder at those times.
- Match the daily chart against your activities, such as sending a newsletter or posting the link on social media, to measure how each action affects views.
Common mistakes
- Expecting views before publishing: until the form is published, there's no public page and therefore no views.
- Treating views and responses as the same thing: a view means someone saw the page, and a response means they submitted the completed form.
- Worrying that yesterday's stats are missing on a new form: previous days fill in only after nightly processing.
- Assuming that refreshing the page raises the number: views are unique, and repeat visits by the same person within a period count once.
Example: If your form gets lots of views but only a handful of responses, the usual culprits are a long form or too many required questions. Splitting the form into steps and showing questions smartly with conditional logic can clearly raise your completion rate.
Next step: for a closer look at responses and turning them into work, read Collect responses and convert them to tasks. To raise your completion rate by making your form shorter and smarter, see Multi-page forms and conditional logic.