
Gantt view: timeline, dependencies and scheduling
Gantt view lays tasks out on a timeline, with zoom levels from daily to yearly, draggable bars to change dates, and dependencies you draw right on the chart.
Gantt view shows your project schedule on a horizontal timeline. Each task is a bar that runs from its start date to its due date, and the lines between bars show which task depends on which. This is where you see how a delay in one task shifts the tasks that follow.
To open it, click the Gantt tab in the project's view bar. The task list is on one side and the timeline chart on the other. Use Chart display to collapse the chart and see only the list.
Zoom and move along the timeline
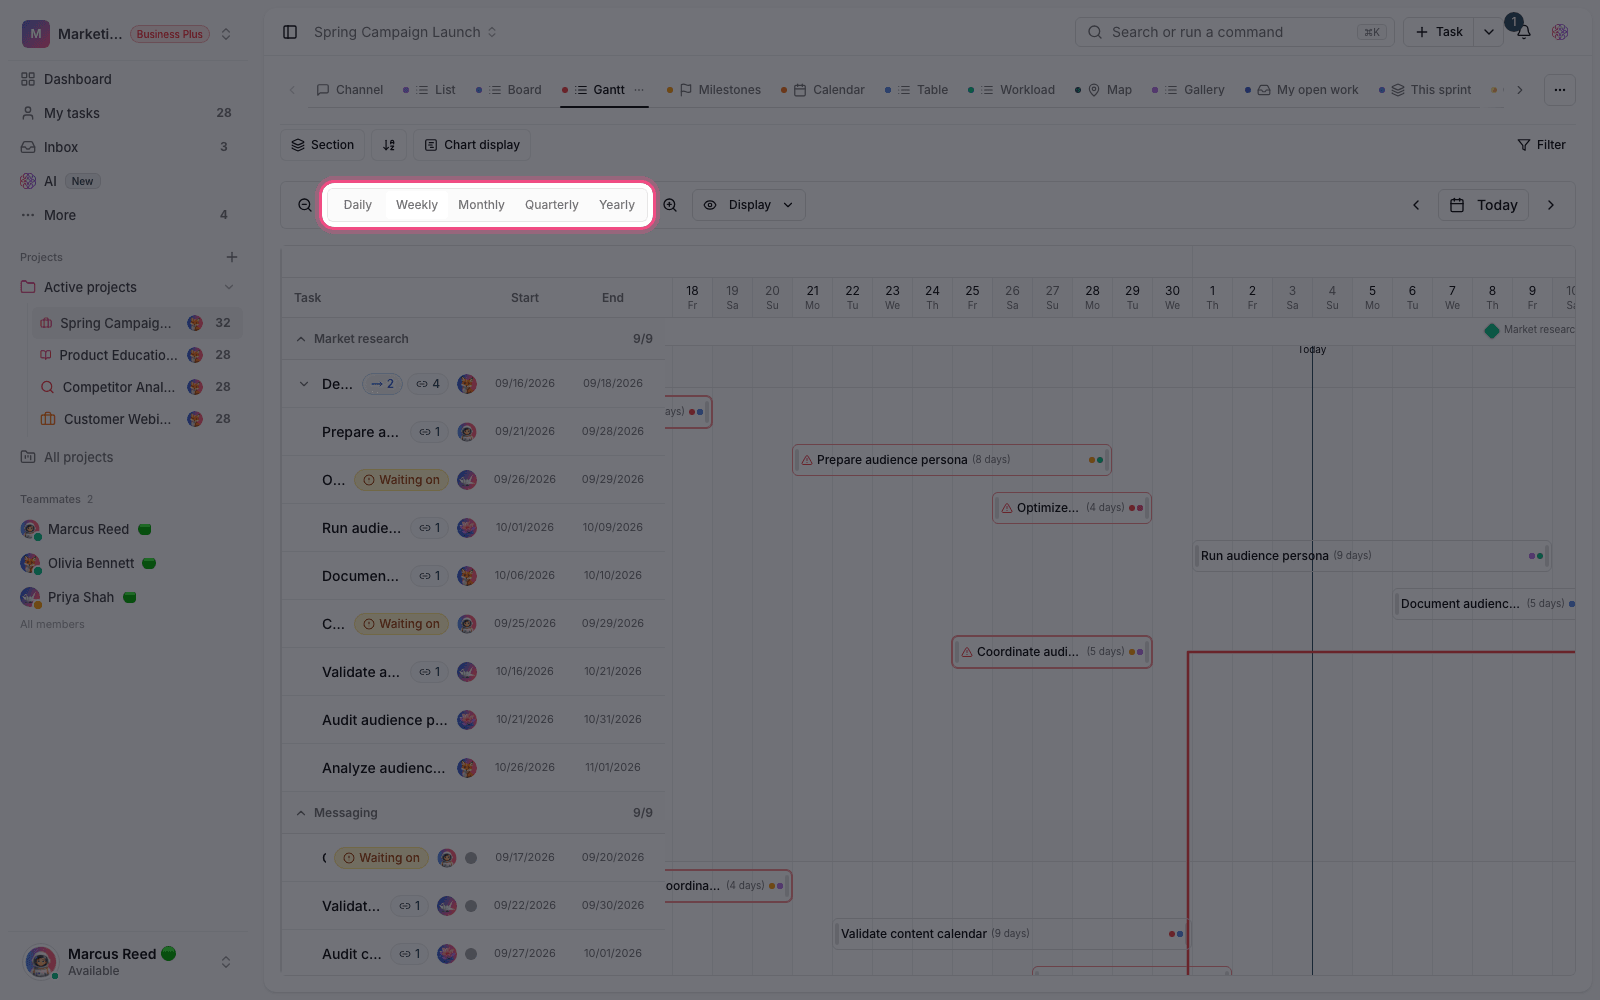
Change the visible range with the zoom buttons: Daily, Weekly, Monthly, Quarterly and Yearly. The width of the date columns changes with each level, so the daily view shows detail and the yearly view shows the big picture of the project.
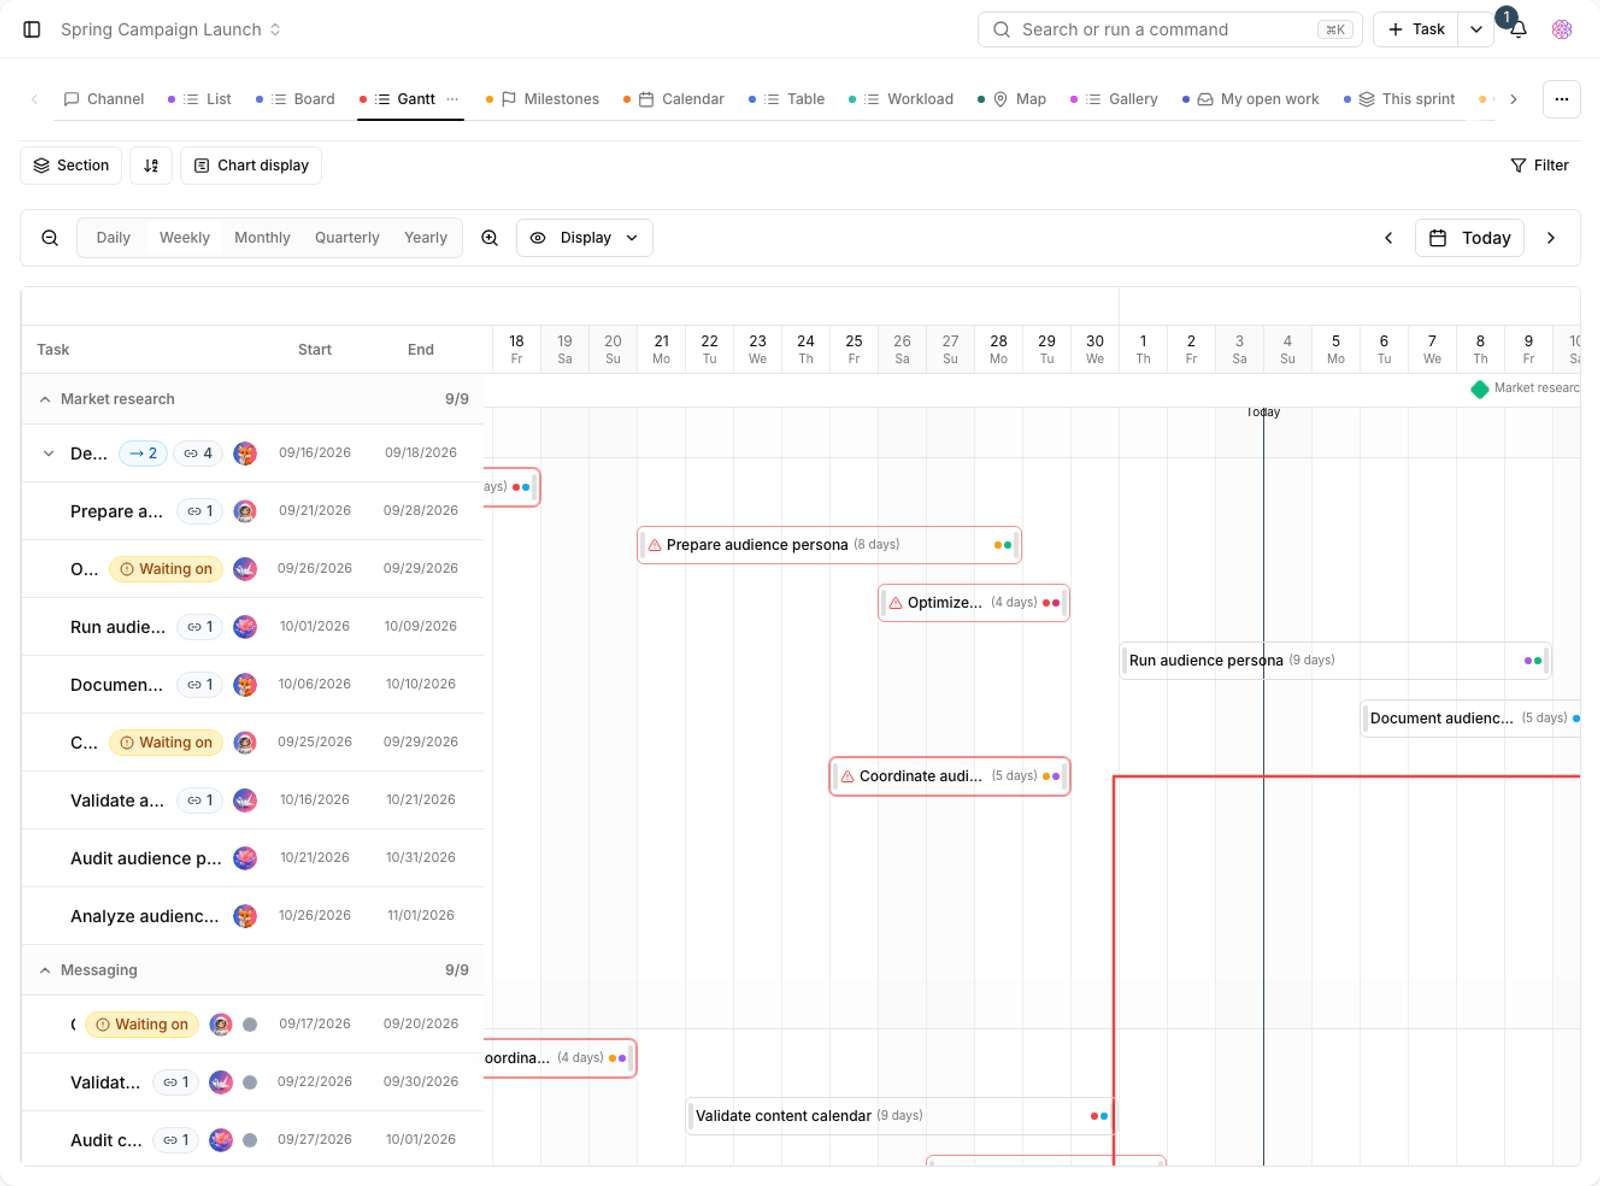
- Today: scrolls the chart to today's date. A Today marker line also appears on the chart.
- Go to start / Go to end: jump to the beginning or end of the scheduled range.
- Zoom in and out: besides the buttons, you can change the level with the Zoom amount control.
- Show weekends: shows or hides the weekend columns.
Reschedule by dragging bars
Change the schedule right on the chart; you don't need to open the task.
- Drag the whole bar to move the start date and the due date together.
- Drag the left or right edge of a bar to change only the start or only the end, making the task shorter or longer.
- Tasks without dates stay in the Unscheduled section. Click the schedule row to give a task a date range.
- If a task has dependencies, Taskie asks whether to apply the change to Only this task or update the whole dependency chain.
Tip: you can also move bars with the keyboard. Focus a bar and use the arrow keys to change its schedule.
Create and edit dependencies on the chart
To connect two tasks, use the connection point next to the source bar (Start a dependency) and drop it on the target bar. The dependency line is drawn right away.
Taskie supports four timing relationships: finish-to-start, start-to-start, finish-to-finish and start-to-finish. Each one can also have a lead or lag. If the dates don't fit the relationship type, you'll see the message "This dependency has a scheduling conflict." so you can fix it before saving.
Gantt display options
Use Display in the bar above the chart to adjust how the timeline looks:
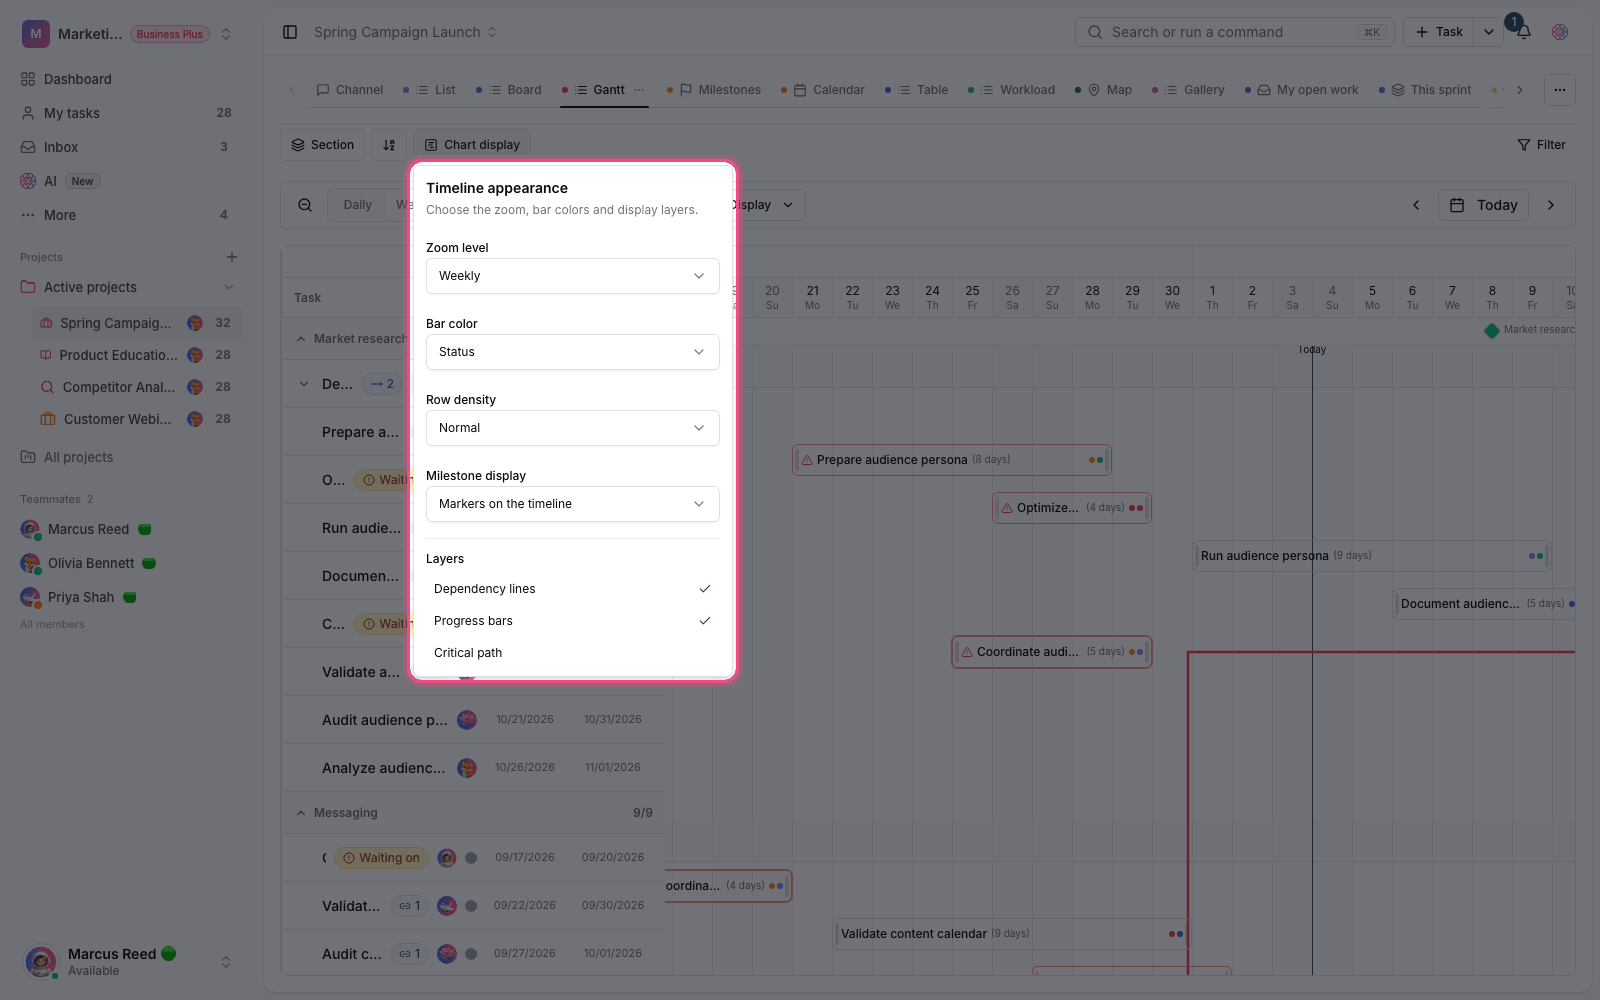
- Bar colors: color bars by status, priority, assignee or labels.
- Task name on bar: write the task title on the bar itself.
- Dependency lines: show or hide the arrows between bars.
- Markers on the timeline: shows the project's milestones as markers on the chart.
- Non-working days: shades holidays and days outside the work calendar.
- Slack: shows how much each task can slip before it causes a real delay, and highlights the project's critical path.
Create tasks from inside the Gantt
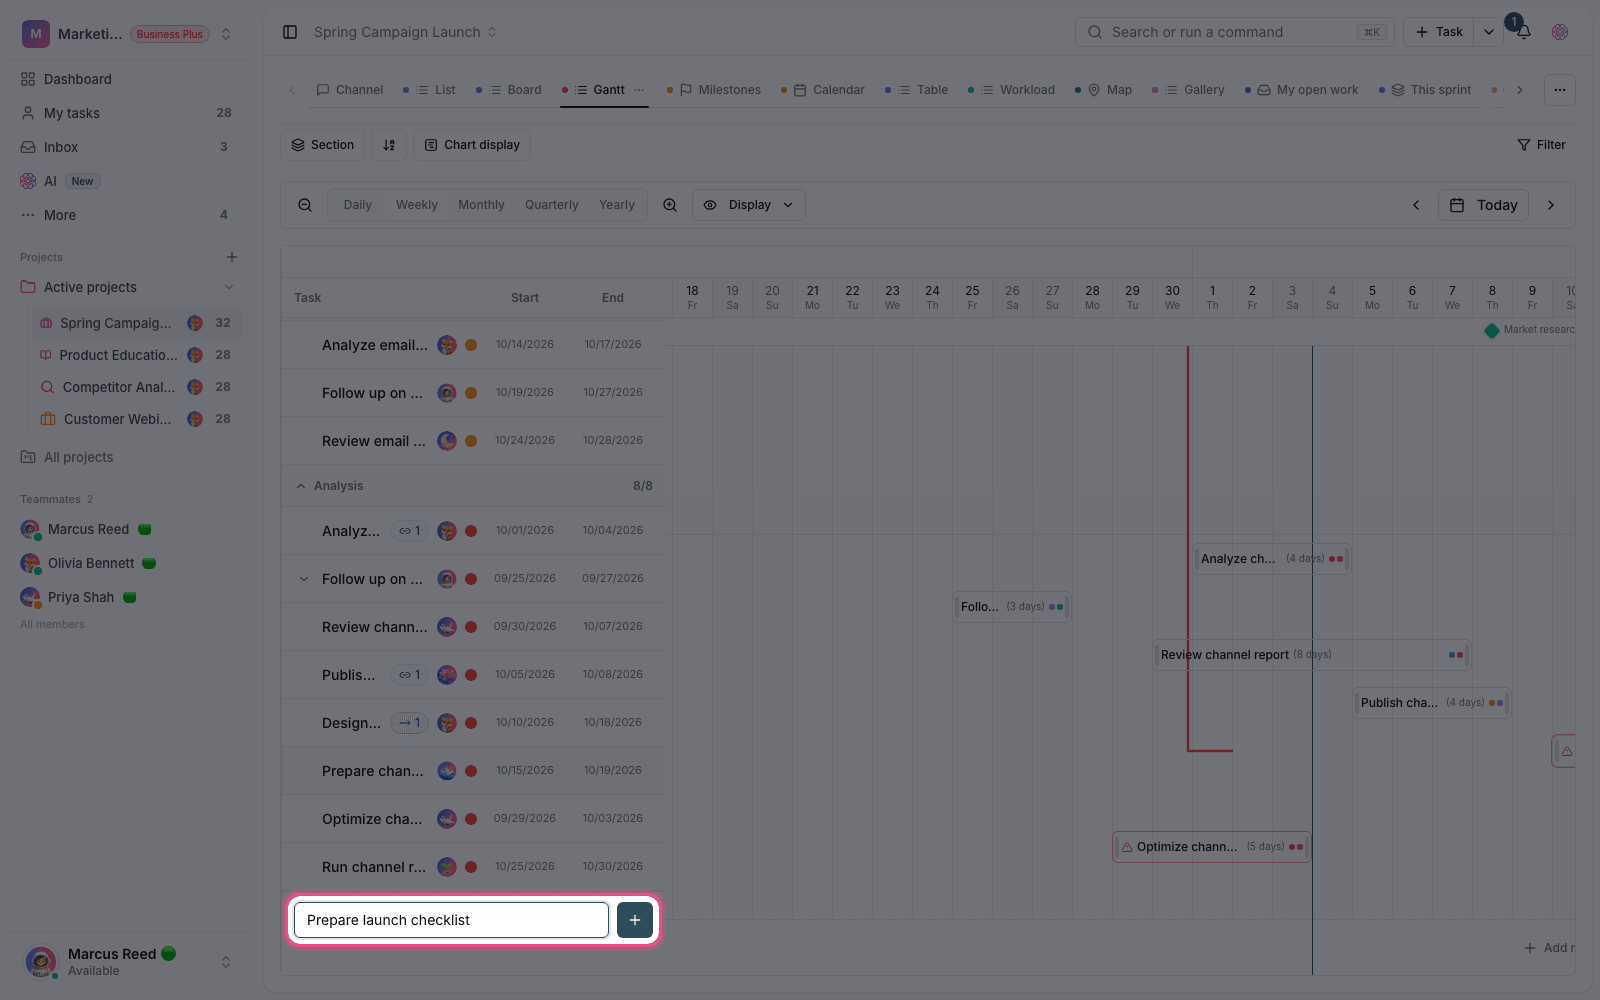
With Add a task to the Gantt, you can create a task without leaving the chart: type the title and set its date range right there on the timeline.
Plan required: Gantt view is available on the Pro plan and above. Saving and comparing a baseline is a separate feature, available on the Business plan and above.
To compare the current schedule with the original plan, read Baselines and schedule variance. To learn about dependency types and how they affect scheduling, see Subtasks and dependencies.