Project dashboard
Every project has its own dashboard: arrange widgets, use a template, or build the layout with AI.
Your personal dashboard covers the whole workspace, but when you want to review the status of one specific project, the project dashboard is more precise: all of its widgets show data from that project only.
To open it, click the Dashboard tab in the project's view bar.
Arrange widgets
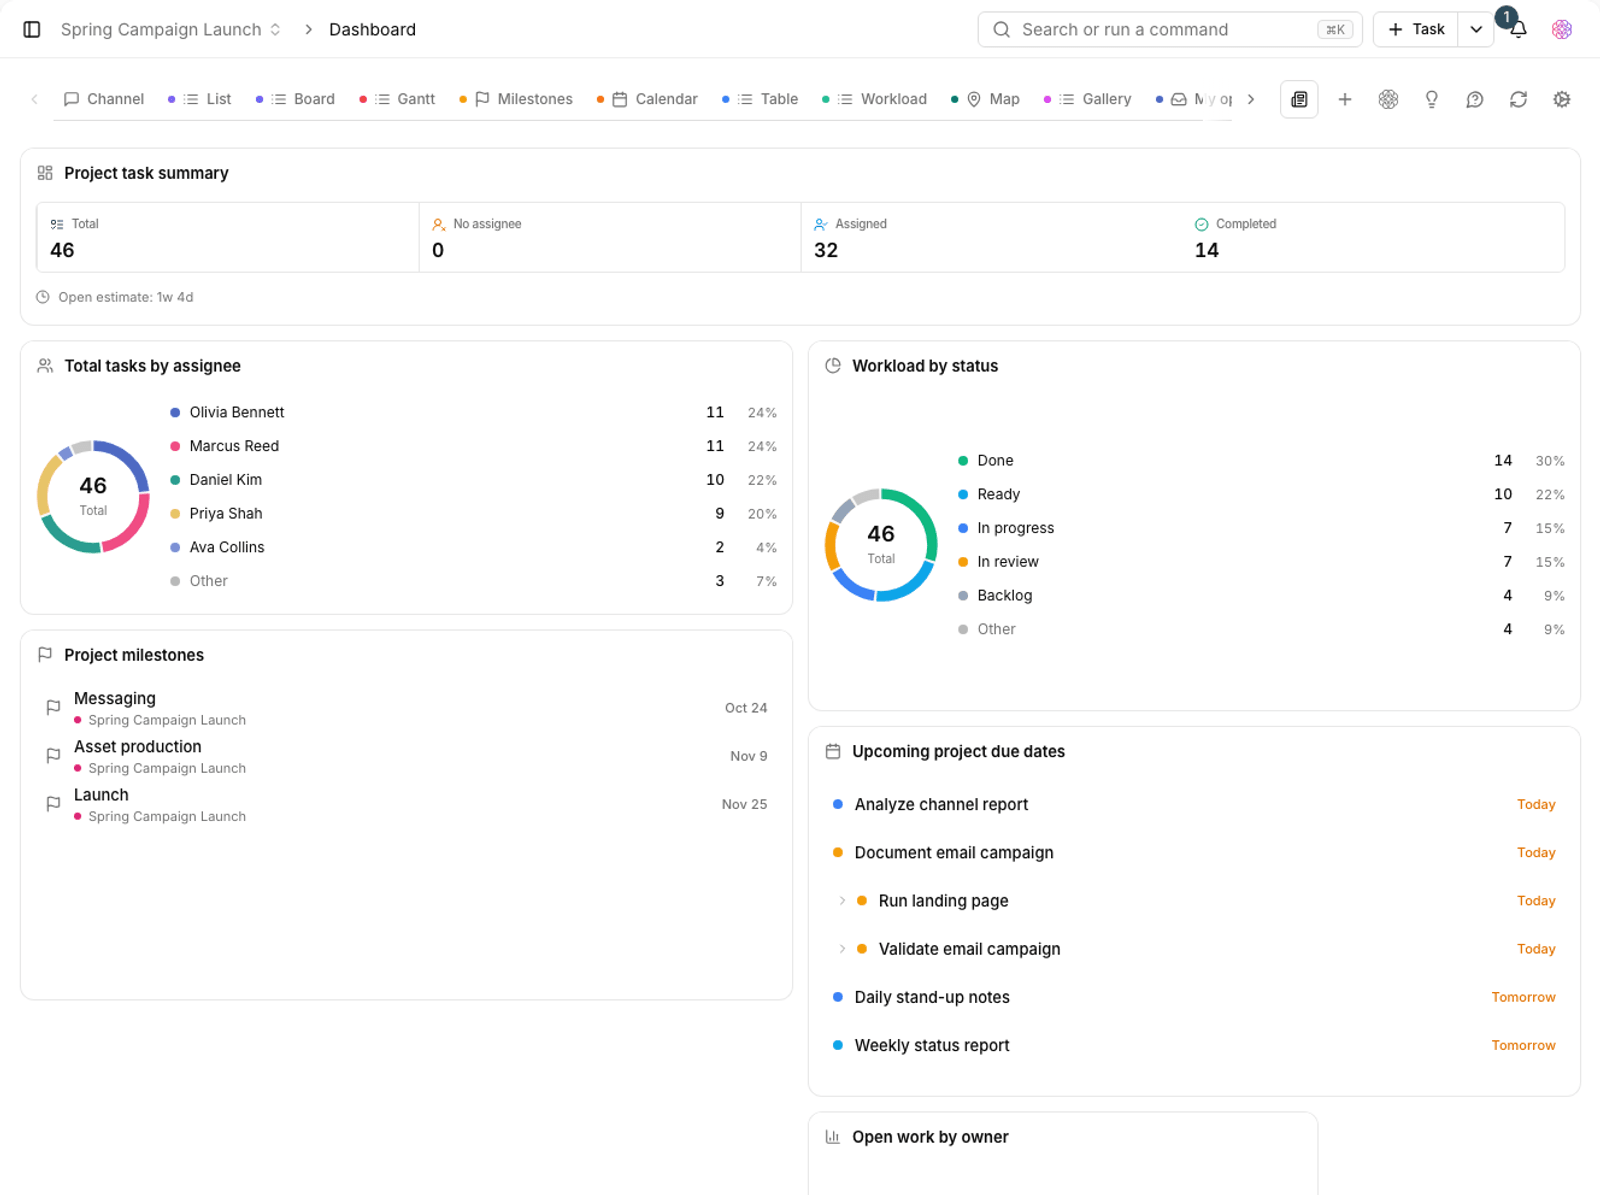
- Click Add widget to open the list of available widgets.
- Pick the widget you want to add it to the dashboard.
- Drag widgets to move them and resize them.
- You can set options specific to each widget, such as its time range.
- Remove unused widgets to keep the dashboard readable.
Widget categories
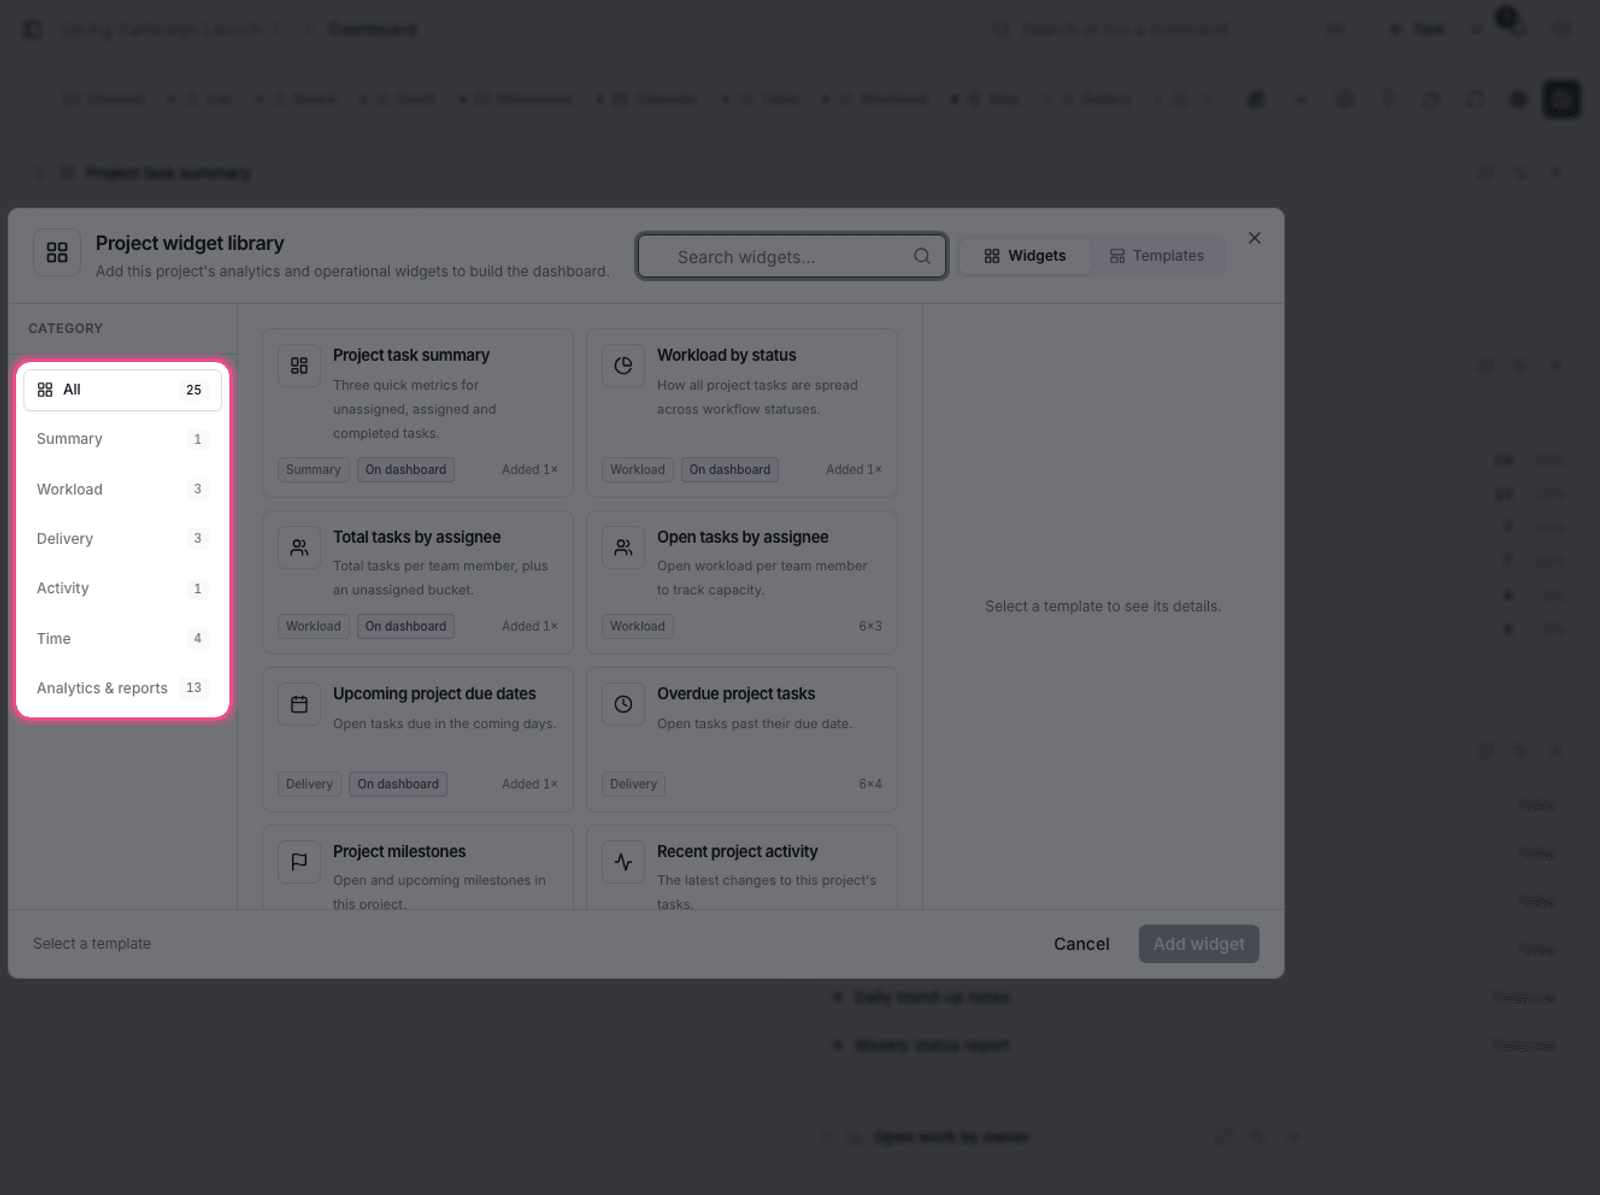
- Progress and status: the share of closed tasks, status distribution and overdue work.
- People: member workload and how tasks are distributed among them.
- Time: hours logged and how they compare with estimates.
- Delivery: agile metrics such as the burndown chart and team velocity.
- Activity: recent changes and member contributions.
Dashboard templates
Instead of arranging widgets by hand, you can apply a ready-made template to the project dashboard to add a set of related widgets at once. After applying it, remove any widgets you don't want.
Build a layout with AI
If you're not sure which widgets are useful for this project, use AI layout generation: you describe what you want to know, and a suggested layout is created that you can review before applying.
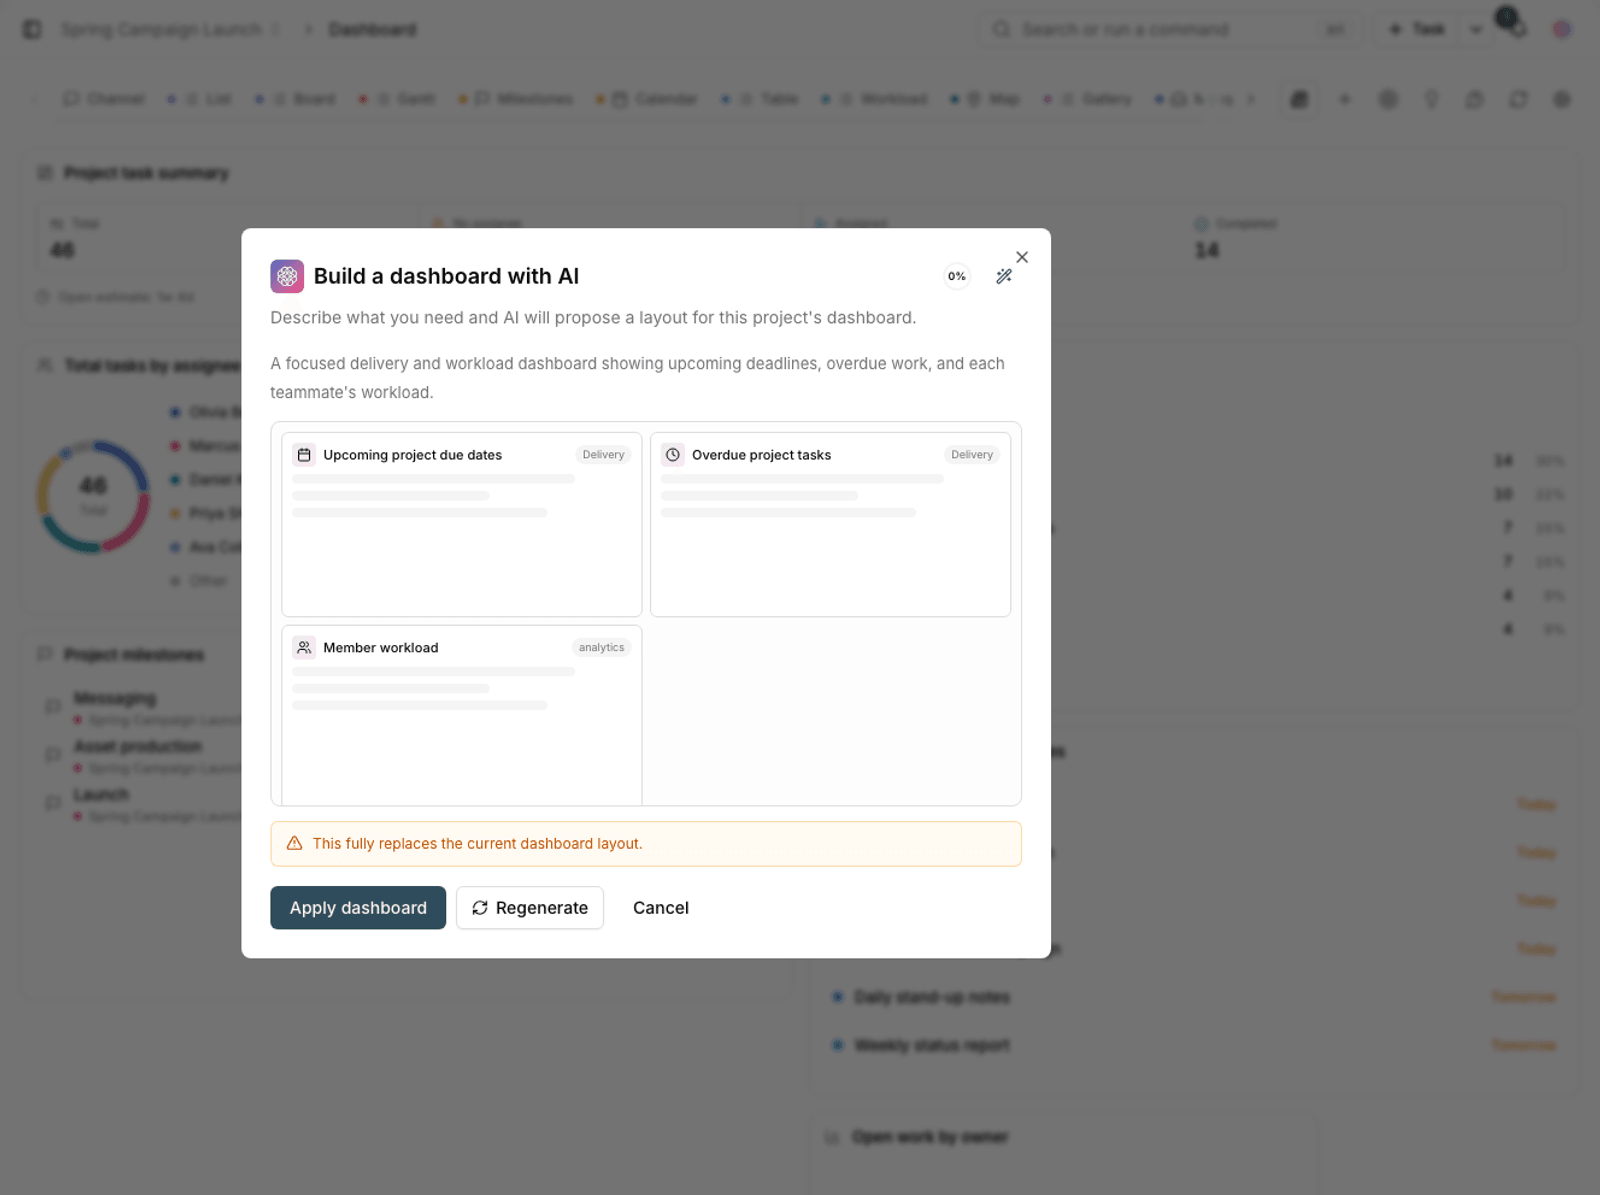
Tip: AI suggestions use the workspace's weekly AI credits. If there aren't enough credits, you'll see a message saying so.
Refreshing data
Widget data is cached so the page opens quickly. If you've just made a change and want a number to update right away, refresh that widget or refresh all widgets at once. You can also use Reset to return the layout to its default.
Project dashboard or time report?
The dashboard is for day-to-day reviews and status meetings. If you need exact numbers for billing or evaluations, go to the dedicated reports. The dashboard summarizes data for readability, and its time range may not match what you need.
- Dashboard: the big picture, good for weekly reviews and status meetings.
- Timesheet: hours logged by member and billing status.
- Sprint report: burndown chart and team velocity for agile cycles.
- Project activity: the history of changes, for looking closely at a specific event.
A dashboard for status meetings
The project dashboard works best in short status meetings. If you arrange the dashboard so the widget order matches the order of the meeting's discussion, the meeting becomes shorter and more focused.
- Top of the page: overall progress and overdue work.
- Middle: member workload and work in progress.
- Bottom: recent activity and items that need a decision.
- Remove widgets that never come up in the meeting.
For your personal dashboard, see Build a dashboard with widgets, and for a metric of your own, see Custom widgets.